One of the coolest moments in troubleshooting is when the device tells you what is happening.

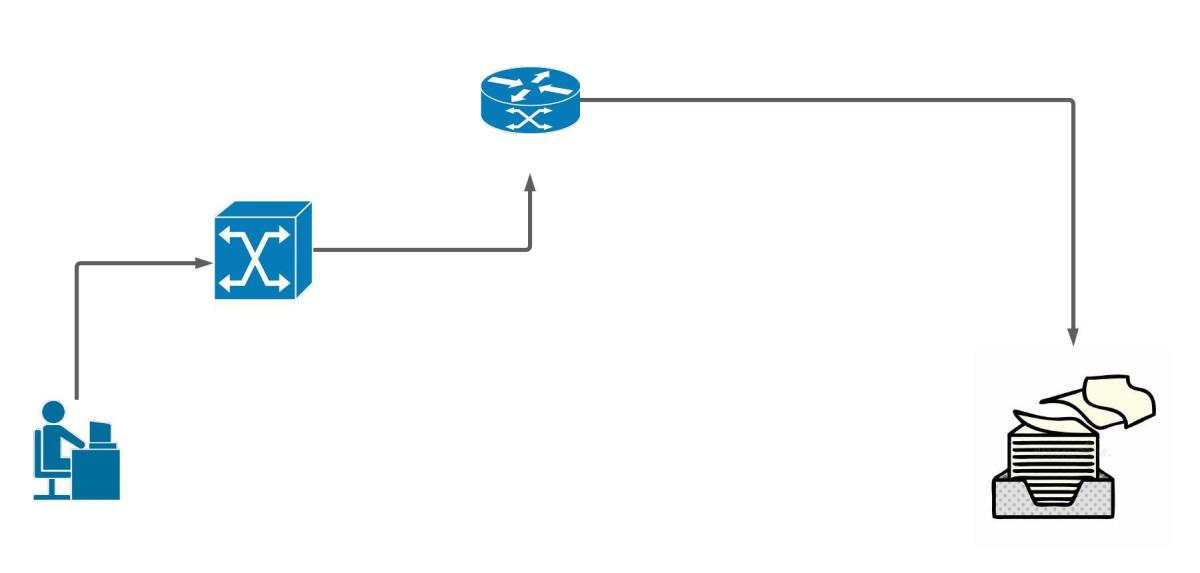
Syslog messages let us know events transpiring on our Cisco devices. We can store logs in the device ram, an external server, or on non-volatile storage on the device.
Defaults:
- By default all logging is sent to the console port
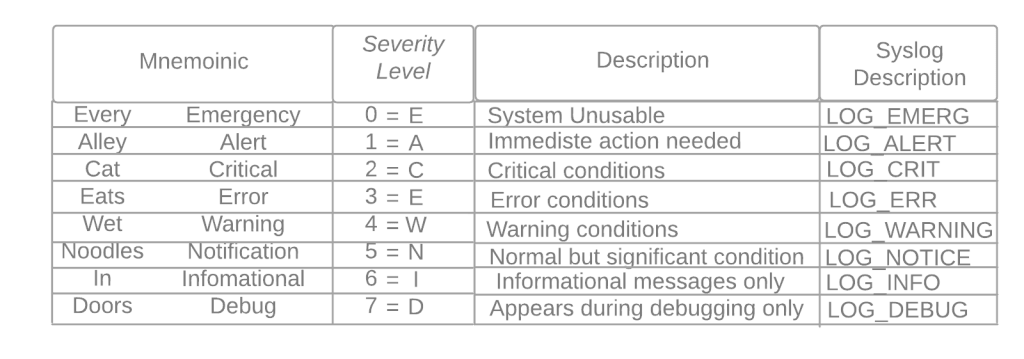
- Default logging level debugging (7) for console, monitor, and buffer.
- Trap logging defaults to informational (6)
- Buffer logging default size 8192, once filled older messages are deleted.
- Service timestamps log|debug datetime – is the default for log messages. Log messages time will match UTC time.
- Logging rate-limit default is 10 log messages per second.
- If nothing different is specified UDP port 514 is used for host logging.

- Console logging – all messages are sent to the console port.
- Monitor logging- messages are displayed on the VTY lines of the device.
- Buffered logging – stores the log messages using a circular buffer in the devices ram.
- Exception logging – The main purpose of it is to restrict or disable the amount of buffered log sent to the console on a system crash
- Persistent logging – stores the log messages from ram buffer to devices flash disk
- Embedded Syslog Manager (ESM) uses syslog filter modules to process system logging messages. Syslog filter modules are scripts written in the Tool Command Language (Tcl) stored in local system memory or on a remote file server.
- Host logging (syslog) – forwards log messages to an external syslog server.
- SNMP logging – uses SNMP traps to send log messages to an external SNMP server.

For proper logging, it is best practice to configure the device’s clock. It is recommended to use ntp.

Configuration to allow logging to all three, ram, server, and flash.
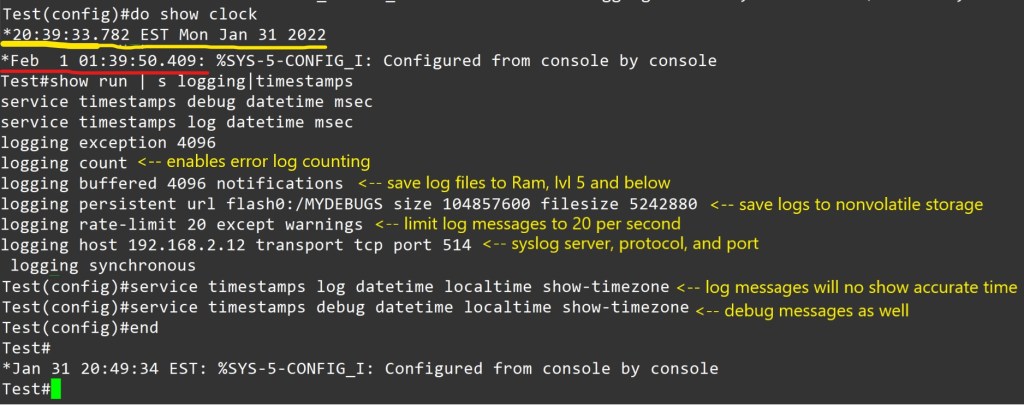
Notes – Using buffered or persistent logging takes away system resources. I should be used cautiously. Verify connectivity to server, port and protocol. Verify service timestamps and ntp settings when facing logging time inconsistencies.
Conditional Debug:
Making a debug as tuned as possible is awesome. Here is an example.
Conditions are turned on with the command
Router# debug condition < parameter>
Ex- Router# debug condition ip 192.168.0.1
Router# debug condition interface g0/1
Router# show debug <– view debugs and conditions

Debugs are removed with no debug condition <#>
Ex- Router# no debug condition 1
When removing the last debug condition you will be prompted.

Debugs without conditions.

I would experiment with this in a lab on the same IOS version you plan to use in a different environment. Turning on debugs is taking the packets from the data plane and sending it to the control plane. You can brick a device or cause it to restart. Not good for professional environments.
As always thank you for your time.
-Notes
- By default, the console port processes all debug output, even when it is logging messages to an internal buffer or when it is sending the debug output to a vty or aux port. A router will prioritize console output; therfore sending a significant amount of debug output to the console port can cause the router to hang. To prevent this from occurring, you should issue the no logging console command unless you are actively logging to the console port. In addition, if you must capture large amounts of debug output, you should always send the output to a vty port. to the aux port, or to an internal logging buffer.
- The no logging on command will cause debug messages to appear only on the console, thereby disabling logging to the vty port, aux port and internal buffers.
